So there's archiveteam. It's a group of "rogue archivists" who want to save as much as possible from the internet, often forcefully. They are cool.
They have a bot, archivebot. It processes commands, saves whole websites and uploads them to archive.org. It's a cool bot.
That bot has a dashboard. It shows the progress of the archiving tasks of the bot. That's cool.
The dashboard is mostly-clientside code (can work as a single standalone html file) that connects to a websocket that throws events, one json object per line. This version of the dashboard is relatively new, or so I've been told. I've never seen the old version.
A few weeks ago, url download queue length reporting was added (which increases with new discovered urls, and decreases with downloaded urls). This is shown as a status number right now, can only see the current value. It's not very exciting. I decided I could try making some pretty graphs.
first problem: the websocket
Websockets are bleeding edge tech or something like that. It's still kinda hard to find libraries to use them from all languages. Mostly because they are hard to implement - last time i checked the spec was an awful monster. All perfectly justified as far as I know but still a monster.
Since I wanted to make this in something not-javascript, I needed some other way to connect to it. I really enjoy doing stuff with pipes in bash, and I'm a huge fan of jq for this reason.
So naturally something equivalent to netcat should be the easiest way to connect to a websocket, right? Ehhh not quite but yeah it kinda worked out fine
iocat
Googling a bit got me iocat, where the io stands for socket.io, so it's written in node.js. Yeah, whatever, not a fan of node.js but it will do.
Mostly decent, but sends informative messages over stdout instead of stderr. Annoying, since it misses the point of a tool that is supposed to work nicely with pipes.
It doesn't handle eof nicely either, but those go to stderr so it doesn't matter as much.
wscat
So, hoping to find something better than this, i found wscat, from an official-looking websocket library for node.js. Started to notice a pattern here.
Installed it. Tried to do the same things.

It's even worse. The output always has colors in the data, even when the output is not a tty, and those are a pain in the ass to remove. My reaction.
dear node.js devs: please learn how to unix. thanks.
(i've been told this "the netcat of websockets". good joke)
nope. back to iocat.
Yeah, iocat wasn't as bad as I thought. In fact I could even send them a PR to unfuck this. Should probably do it later. Meanwhile, | grep -v '^> ' | fixes it.
So the commandline is now:
iocat http://arshboard.at.ninjawedding.org:4567/stream | grep -v '^> ' | jq .
The jq . at the end is for pretty printing (and validating) the input.
the json
One example item looks like this:
{
  "url": "http://i.obozrevatel.ua/8/765578/309924_image_large.jpg",
  "wget_code": "OK",
  "is_warning": false,
  "ts": 1411866868.6528623,
  "response_code": 301,
  "type": "download",
  "is_error": false,
  "job_data": {
    "url": "http://obozrevatel.com/",
    "fetch_depth": "inf",
    "log_key": "941brszf012ko3g5t6raqqf8m_log",
    "user_agent": "",
    "ignore_patterns_set_key": "941brszf012ko3g5t6raqqf8m_ignores",
    "slug": "obozrevatel.com-inf",
    "started_by": "ivan`-",
    "started_in": "#archivebot",
    "delay_min": "250",
    "delay_max": "375",
    "settings_age": "7",
    "concurrency": "5",
    "queued_at": "1409710621",
    "pipeline_id": "pipeline:4f15f8f9400cdbf7d3066c34a04f1270",
    "started_at": "1409710623.7527165",
    "log_score": "3853624",
    "r1xx": "0",
    "r2xx": "2366209",
    "r3xx": "1196333",
    "r4xx": "181657",
    "r5xx": "3107",
    "runk": "41678",
    "error_count": "44785",
    "last_analyzed_log_entry": "3853623.0",
    "last_broadcasted_log_entry": "3853623.0",
    "heartbeat": "2149479",
    "last_acknowledged_heartbeat": "2149479",
    "bytes_downloaded": "183690787637",
    "death_timer": "0",
    "last_trimmed_log_entry": "3853328.0",
    "suppress_ignore_reports": "true",
    "note": "Ukranian news org",
    "ident": "941brszf012ko3g5t6raqqf8m"
  }
}
extracting the interesting parts
This took some tinkering to get right, but not a huge problem in itself. The select filters the task I'm interested in, and the last part substracts items_downloaded to items_queued to get the same value shown in the web UI.
iocat http://arshboard.at.ninjawedding.org:4567/stream | grep -v '^> ' |
    jq -r '.job_data | select(.ident == "1ot4nkzdot5580ppaxfaxxpum") | ((.items_queued|tonumber) - (.items_downloaded|tonumber))' |
    tee queue_lengths
This outputs one number per line, the universal format™
second problem: plotting.
I don't trust plotting libraries. They are often over-engineered, with an absurd learning curve and making it really hard into them. Or sometimes the opposite, so simple that they can't get basic tasks right.
I've had bad experiences with them in the past. When this happens, instead of googling random crap, I use my Proven Method For Acquiring Reliable Software™. That is, bother a few friends on irc with vague questions that waste everyone's time until someone comes up with a decent recommendation. In this case I wasn't even sure what i wanted. It wasn't very efficient.
Summary of what was suggested/tried.
jqplot: I'm pretty sure I tried this one before and it was pretty bad. Also seems to be for jquery and that's sooo last decade.d3: Looks awesome at first. After reading the documentation for 5 minutes, it turns out to be a svg-aware jquery replacement, not a data visualization library.dimple: Supposed to be a graph library based on d3 but higher level. Couldn't get it to understand the concept of only having one column with numbers and, well, no title. When it worked, performance was awful and didn't have magic autoscaling. Meh. 6/10 at least I got some data points on screen.nvd3: Didn't get to try this one. Sounds like something right between d3 and dimple, abstraction-wise.highcharts: Also didn't get to try this one. Didn't feel like javascript at that point.matplotlib: I know this one doesn't suck. I'm not a huge fan of it, but last time I did this, it was the least shitty library. I guess it will be better once I'm used to it. Today I decided to avoid it, hoping to find something better.gnuplot: This one won. Very pipe friendly. Not perfect since it doesn't handletail -fnicely, but really, this is all it takes:cat queue_lengths | gnuplot -p -e "plot '-' with lines"or
$ gnuplot
...
gnuplot> plot 'queue_lengths' with lines
With the latter mode being interactive, and you can do "replot" to reread the file. Also, the default "output" is "qt" (as in, the graphics toolkit that kde uses), and it really surprised me that it looks like something from this century.
the result
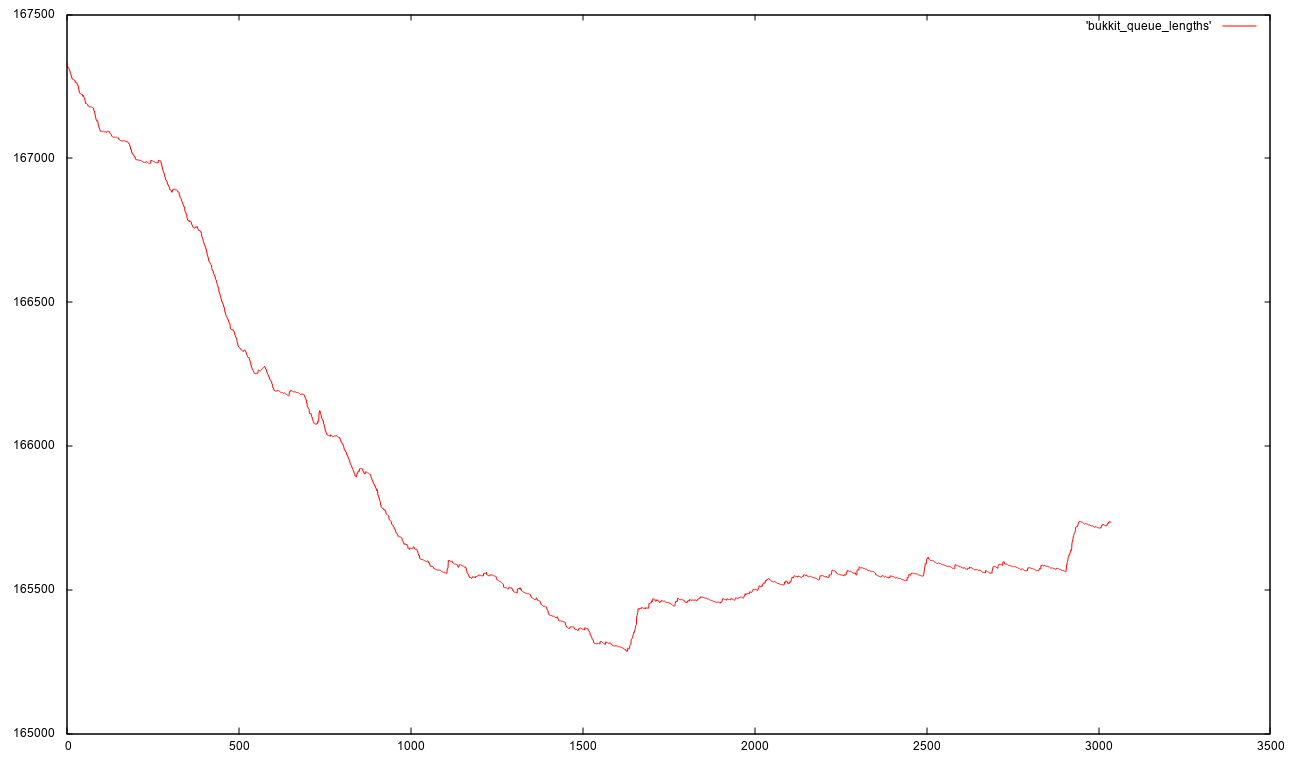
It's not interactive advanced javascript + svg + whatever but i'm pretty satisfied with this.